
City Streetlights
Streetlights have a profound impact on the vitality of a city. Good street lighting reduces crime, increases night-time economic activity, and prevents auto accidents. The streetlight network is one of the most large-scale and expensive components of a city’s public infrastructure, and streetlights are a major contributor to a city’s electricity use and carbon footprint.
That raises an important question: how should the city make decisions about how to replace and expand the streetlight network? And what criteria should be used to make these decisions? The lights use a significant amount of energy, so lights can be replaced with energy-efficient bulbs to reduce the city’s carbon footprint. The network can be expanded to bring more light to underserved neighborhoods. Light pollution can be taken into account. And decisions can be made to reduce the cost to city in the short and longterm.
All the data that the city needs to weigh these factors and make good decisions exist, but are currently stored in different places and with different formats. Because the data haven’t been brought together in one unified analytic platform, the city of Charlottesville usually allows the energy company it contracts with to manage the streetlights, Dominion Energy, to make replacements to the streetlights on their own schedule.
This project will tackle the problem of wrangling Charlottesville’s various streetlight data to build a tool that maps the streetlights and displays all the information the city would need to know about each individual streetlight in an intuitive application. This app will include calculators to help the city find the replacement schedules and expansion strategies to minimize the network’s energy use and cost, increase the coverage and quality of the light, and generate greater social equity through expanding in neighborhoods that lack sufficient lighting.
Project Goals and Deliverables:
- To wrangle the various data sources from the city and from Dominion to match records and bring all of the information about individual streetlights together in one analytic-ready database.
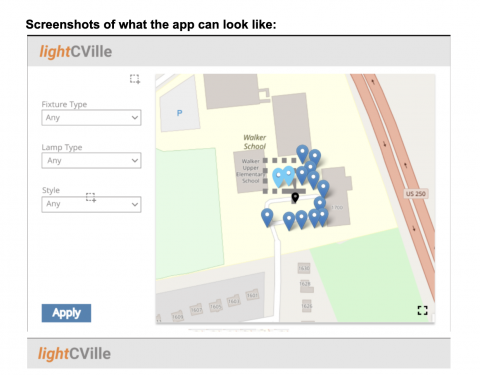
- To develop a web-based application with the streetlight database as a backend, and a front-end that includes the following features:
- A map of the streetlights in Charlottesville
- A clickable interface for viewing the data about specific streetlights, such as the type of bulb and fixture, the age of the bulb, and the quality of the light emitted by the bulb.
- Calculators that display the cost, energy consumption, light quality, and lighting as it correlates to socioeconomic factors in different neighborhoods.
- An interface that allows these calculators to be used to generate a replacement schedule that minimizes cost or energy use, or provides better lighting to underserved neighborhoods.
Design Specifics and Requirements:
The purpose of the tool is to provide outputs for different streetlight replacement scenarios. The tool will have a main menu, from which the user can produce a variety of scenarios. Within each scenario are a set of cards, each showing one or more sets of streetlights that have been selected and considered for replacement by the users. The set of cards comprises the scenario. The outputs for each scenario will show a breakdown of costs (NPV) given particular replacement schedules and discounts. On the main menu, the user can break the entire streetlight catalogue into sets based on location and bulb type (and potentially other characteristics as defined going forward). The sets will be shown on cards where the replacement schedule, new bulb type, and discount rate can be specified. The main menu will both show and keep a count of streetlights that have not been assigned a set yet. At a given time, the user interface indicates which scenario and which card is being edited.
Features of the main menu:
- The extent of the main menu will be the city of Charlottesville. Features will include the streetlight locations as points. It will be possible to pan and zoom within the extent, and to return to full extent.
- A checkbox menu of bulb types will be available.
- A checkbox menu of neighborhoods will be available.
- Drawing tools to make rectangular or freeform selections will be available.
- When all of a location or bulb type has been selected, it will become grayed on the checkbox.
- When a particular streetlight has been selected for a card, it will become grayed out on the map.
- A running count of selected and unselected streetlights will be displayed.
Features of the cards:
- A card of the selected set of streetlights will show the extent and streetlight points.
- The user will be able to select the replacement schedule, discount rate, and bulb type.
- The card will display the selection criteria on it (e.g., Rugby Rd & Bulb Type A)
- The user can delete the card, such as through an 'x' in a top corner.
- The active card (the card being edited) will be visually distinguishable, such as through highlighting around the border of the card.
Features of the outputs:
- The output will list the scenarios that are being explored by the user and the computed cost of the scenario.
- The active scenario (the scenario being edited) will be visually distinguishable, such as through highlighting around the border.
- The user will have a command that copies the scenario (to use as the basis for a new scenario)
- The user will have a command that re-runs the scenario, if cards within the scenario are changed.
- The user will have a command to create a new scenario that starts with a clean Main Menu and no cards.
- Each scenario in the list can be expanded. The expansion shows the selection criteria for each card (e.g , Rugby Rd & Bulb Type A), the replacement schedule, discount rate, and new bulb for each card, and the computed cost for each card. The total cost for the set of cards comprising the scenario is also shown.
- The expanded list of scenarios can be exported as a spreadsheet.
Additional features and requirements of the tool:
- The tool saves all scenarios. Each time the tool is opened, the user can resume where they left off.
- When the user makes a new section, the tool provides an output based on that selection.
- If the user has not made a selection, an output is not provided. Message: No streetlights selected.
- If no streetlights meet the selection criteria, no output can be generated. Message: No streetlights meet those criteria.
- Only a single output (deterministic) can be generated for a given selection.
- Outputs must change after the user changes the selection. Message: Working…done.
Tentative working timeline:
- December 2020 -- January 2021: formation of the leadership team for this project. Meet with Susan and Kirk to understand the goals of the project. Write a project proposal document.
- February 2021: recruit volunteers from the Charlottesville community and UVA to work on the project. Generate a system of project management that allows many volunteers to do meaningful work to help with different parts of the design and coding.
- February -- April 2021: regular “hack night” events with the leadership team and volunteers to develop a minimum viable product version of the app
- Late spring/summer 2021: working with Susan, Kirk, and other stakeholders to assess how the tool is meeting the needs of key users. Continued work to debug and expand the functionality of the app.